3,022,130View users
Where do users drop before purchase?
Independent portfolio case studyMarketing Data Analyst connecting acquisition, conversion, retention and profitability data to clearer growth decisions.
Selected evidence from independent portfolio case studies, with scope and ownership documented on every project page.
Three professional chapters show a deliberate progression from campaign execution to reporting, data preparation and BI delivery.
Digital execution
May 2024 – Aug 2024Internship · Paris, Île-de-France, France
Selected responsibilities
Marketing reporting
Sep 2024 – Aug 2025Apprenticeship · Strasbourg, Grand Est, France
Selected responsibilities
Data & BI foundation
Mar 2026 – Aug 2026Latest experienceInternship · Paris, Île-de-France, France
Selected responsibilities
Direction
Marketing Data AnalyticsConnecting acquisition, conversion, retention and profitability questions to decision-ready analysis.Independent portfolio work demonstrating how acquisition, conversion, retention, profitability and data reliability become marketing priorities.
Independent portfolio case study
Observed signal / strict user funnel
View users
3,022,130Cart users
336,718Purchase users
196,474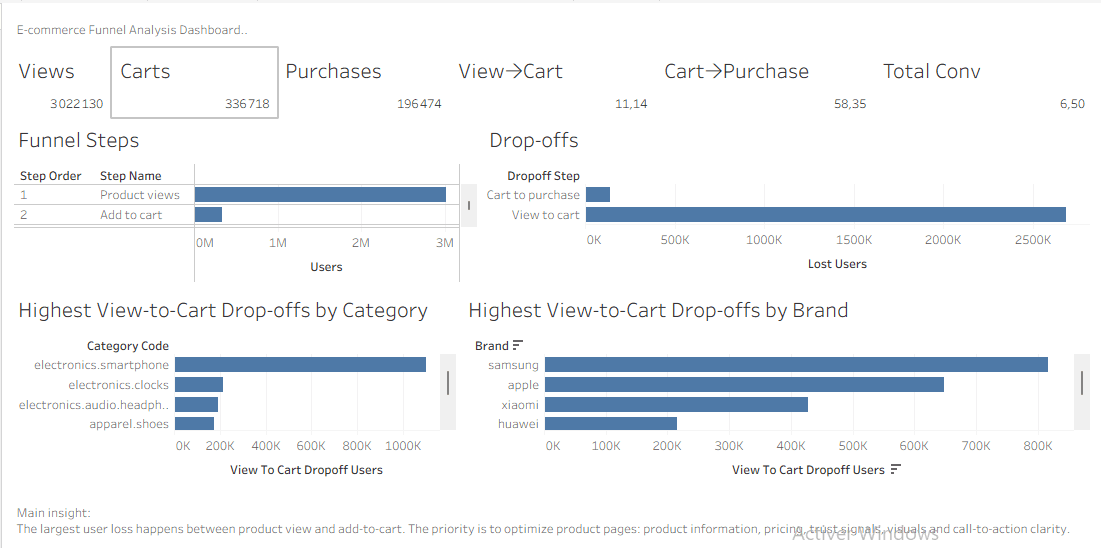
Analytical interpretation
Only 11.14% of viewers add to cart, while 58.35% of cart users complete a purchase. The primary conversion bottleneck is therefore product view → add-to-cart, not checkout.Decision / recommendation
A/B test product page CTAs and add-to-cart visibilityDataset noteExternal event-level e-commerce data used for analytical demonstration. The full dataset is excluded from the repository because of its size; a sample, aggregated outputs and methodology documentation are provided. This is not a client engagement.
Independent portfolio case study
Business question
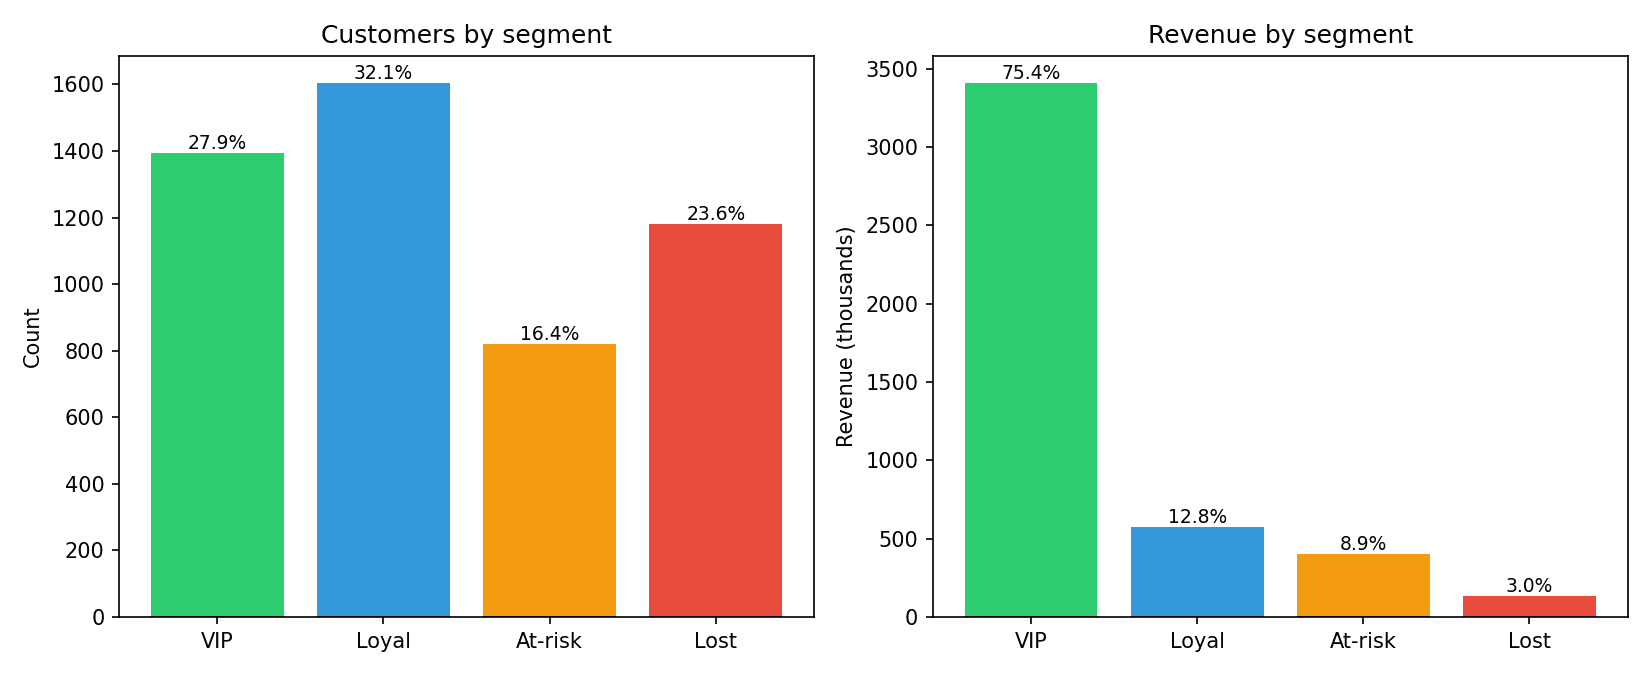
Observed signal / customer concentration
Dataset noteSynthetic but business-realistic e-commerce order data generated with Python. The dataset contains 5,000 simulated customers and 45,356 orders and does not represent a real company.
Complete case studyIndependent portfolio case study
Business question
Observed signal / commercial diagnosis
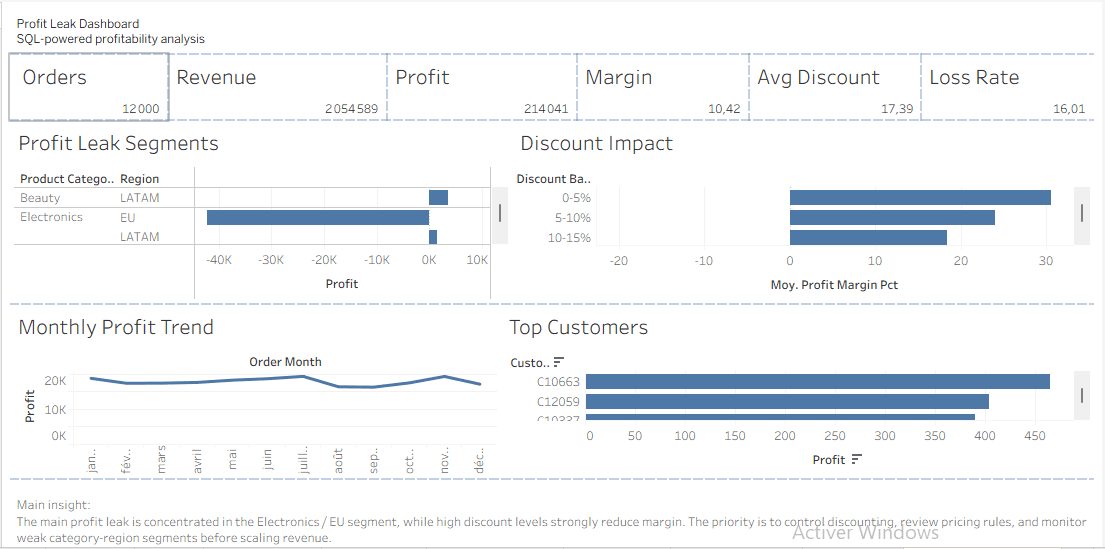
Dataset noteSynthetic e-commerce order data generated with Python. The analysis covers 12,000 simulated orders and does not represent the performance of a real company.
Complete case studyIndependent synthetic B2B analytics system
Business question
Observed signal / KPI trust gate
Data status
SyntheticKPI status
GatedDecision output
Diagnostic scenariosImpact claim
None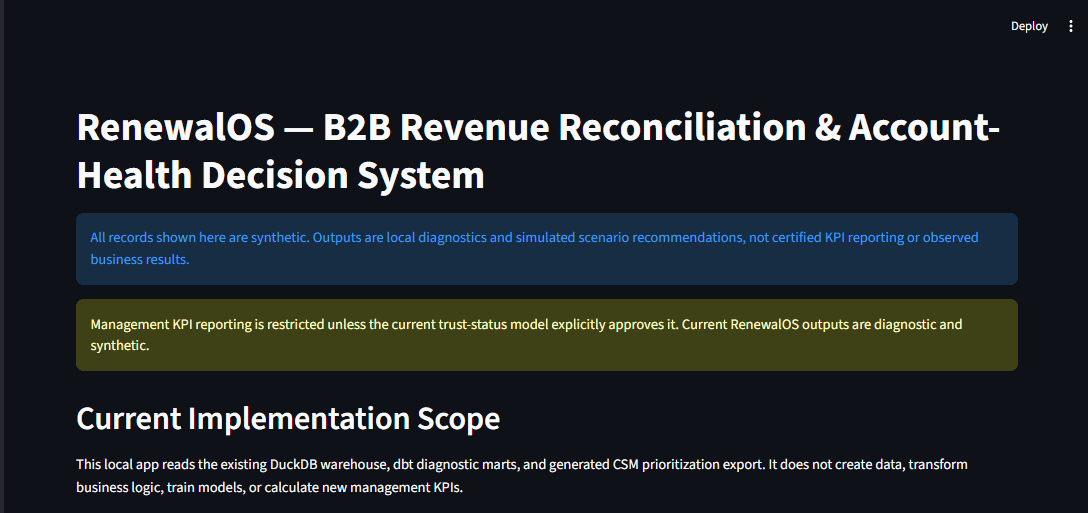
Analytical interpretation
Decision outputs are restricted until source-data exceptions and reconciliation gaps are visible and reviewed.Decision / recommendation
Review quality exceptions before treating ARR, churn or renewal metrics as management KPIsDataset noteSynthetic B2B data only. No production customer data, production deployment, observed intervention result or real business impact is claimed.
Method / from ambiguity to action
Input
Produces
A decision-shaped scopeReceives
Produces
Trusted analytical inputsReceives
Produces
A decision-ready signalReceives
Produces
The next business decisionQuestion → evidence → interpretation → decision
A capability index grounded in independent portfolio evidence—not a keyword inventory.
Locate acquisition friction, conversion drop-off and customer priorities.
Capabilities
SQL / DuckDB · Tableau · Python · pandas · CRM analytics
Turn source data into defined KPIs, validated models and usable reporting.
Capabilities
DuckDB · dbt · SQL · Python · Streamlit · OR-Tools · SQL / DuckDB · Tableau
Connect commercial performance signals to profitability and account decisions.
Capabilities
SQL / DuckDB · Tableau · Python · DuckDB · dbt · SQL · Streamlit · OR-Tools
Foundation → application → specialization
Economics and management
Université Paris-Panthéon-Assas
Digital business and marketing
EBS Paris – European Business School
Data management and AI
INSEEC MSc
Marketing Data Analyst | Growth, Acquisition, Conversion & Retention
Available for a Marketing Data Analyst apprenticeship from September 2026.